

[dropcap]C[/dropcap]andlestick patterns have a unique following among price action enthusiasts and technical analysts. They are widely popular due to fact that they reflect market sentiment visually.
When you see a red or a black candlestick, you automatically know that for the session, price closed lower. Likewise, when you see a green or a white candlestick, you know that price was bullish during the session.
Aside from these simple visual depictions, the way a candlestick closes also provides Forex traders with a lot of information.
There are many different types of candlestick patterns. These range from the simple, single candlesticks to double, triple and many more complex types.
Focusing merely on the candlestick patterns alone does not help one’s forex trading. It is the market context that needs to be taken which gives more meaning. The markets are irrational. Therefore, it is not surprising to see that even the most reliable candlestick patterns can fail.
The trick is in identifying some commonly occurring candlestick patterns and then building a market context around it. This brings us to the question of what the most common candlestick patterns are.
What Are the Most Common Candlestick Patterns? Common Candlestick patterns
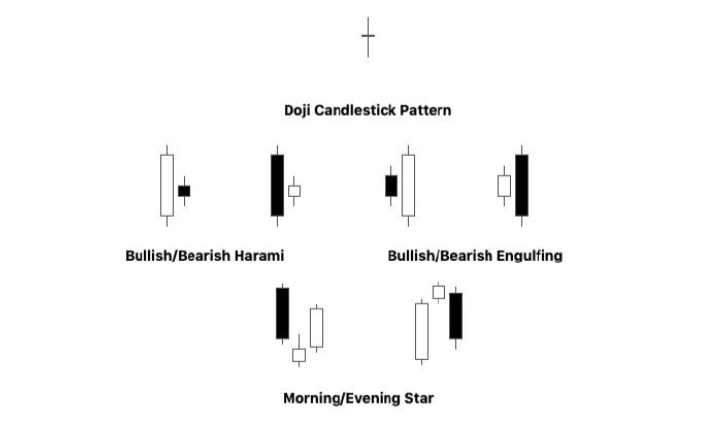
Common Candlestick patterns
The Doji
The doji is no doubt one of the most commonly occurring candlestick patterns. What’s unique about the doji pattern is that it is a single candlestick pattern. A doji is formed when price opens and closes at the same level (or up to a certain extent from the open).
There are different types of doji’s no doubt, but they imply the same meaning, which is market indecision. What comes next after the doji and the price level where this candlestick pattern appears makes it meaningful.
Typically, a doji can occur near a resistance level. Following this, when you see a bearish move after the doji, it could signal that there are more sellers in the market. However, if you see a bullish candlestick after the doji, you could infer that the market trend is to the upside.
Harami and Engulfing Patterns
The Harami candlestick pattern is just the opposite of an engulfing pattern. These candlestick patterns are reversal and continuation patterns respectively.
Common knowledge dictates that when you see a harami pattern after a prolonged trend, it could signal a correction or a reversal to the trend.
Likewise, the appearance of the engulfing pattern within the trend indicates that the trend is likely to continue.
But the above statements are subjective. The behavior of price after the formation of the candlestick patterns depends a lot on the market context. Therefore, traders should pay attention to the price levels where the candlestick patterns appear.
Evening/Morning Star
Both these candlestick patterns are perhaps the most reliable especially when it comes after a prolonged trend. The evening and morning star patterns are based on three candlesticks.
Because of the fact that three candlesticks (namely three sessions) are combined, these candlestick patterns are more reliable than the rest. However, once again, context plays an important role.
How to Make Candlestick Patterns More Reliable
Many traders tend to think that they can make money by simply relying on candlestick patterns. The truth is that candlestick patterns are by no means a guarantee that price will behave in a certain way.
There are a number of ways to make candlestick patterns work for you.
Candlestick patterns work best with support and resistance levels, including trend lines and retracement levels. But you can also use them alongside technical trading indicators.
For example, a reversal candlestick pattern near a 200-day moving average can send a strong signal that price could be looking to reverse off the MA.
If you have been trading for a while, then you would know that you should not rely on just one indicator alone. This holds true with candlestick patterns. In order to make them more reliable, you can start by focusing on the commonly occurring patterns.
Once you have mastered the concept of spotting these patterns visually, you can then bring in your technical analysis expertise to validate the trading signals.